Farmers in Brazil are expected to plant more soybeans and less corn in the 2023-2024 crop season, according to the National Supply Company (Conab), the country’s food supply and statistics agency. The reason? Producers find corn prices unattractive relative to soybeans. In addition, the El Niño weather pattern has adversely affected the outlook for corn in Brazil. This article focuses on the first official government estimates for soybean and corn acreage, production in the new crop season, and planting rate to date. In addition, we discuss the latest balance sheets on supply and demand estimates for corn and soybeans that bear watching.
El Niño Weather Pattern Could Affect Yields
Three consecutive growing seasons under La Niña influence generated severe droughts for Argentina and Brazilian southern states (see farmdoc daily, March 31, 2023). However, this crop season will be very different. El Niño has developed in the tropical Pacific Ocean, and its weather pattern is already affecting Brazil’s grain outlook. In Rio Grande do Sul, Brazil’s southernmost state, heavy rains have considerably delayed the first corn planting in September.
El Niño is a climate pattern characterized by unusual warming of surface waters in the eastern tropical Pacific Ocean. El Niño is the “warm phase” of the larger phenomenon El Niño-Southern Oscillation (ENSO). La Niña, the “cool phase” of ENSO, is a pattern that describes the unusual cooling of the region’s surface waters. Generally speaking, the effects of El Niño are the opposite from La Niña for South America.
During the growing season under El Niño influence, northern Brazil usually sees below-normal rainfall, which can also bleed into portions of central Brazil, the main agricultural region. Temperatures also are generally higher, increasing the risk for crops. However, the weather pattern across Argentina and southern Brazil is more active, and rainfall amounts trend above average for the spring and summer (Baranick, 2023).
Record Year Forecasted for Soybean Area and Production
The 2023/2024 soybean crop is projected to be a record 5,953 million bushels, an increase of 4.8% over the previous harvest. Brazilian soybean acreage is expected to grow 2.5% to 112 million acres, according to Conab (see Figure 1). The largest expansion in percentage terms will be in Brazil’s North and Northeast regions, with some expansion coming from the conversion of pasture to crop land while some of the expansion comes at the expense of other crops.
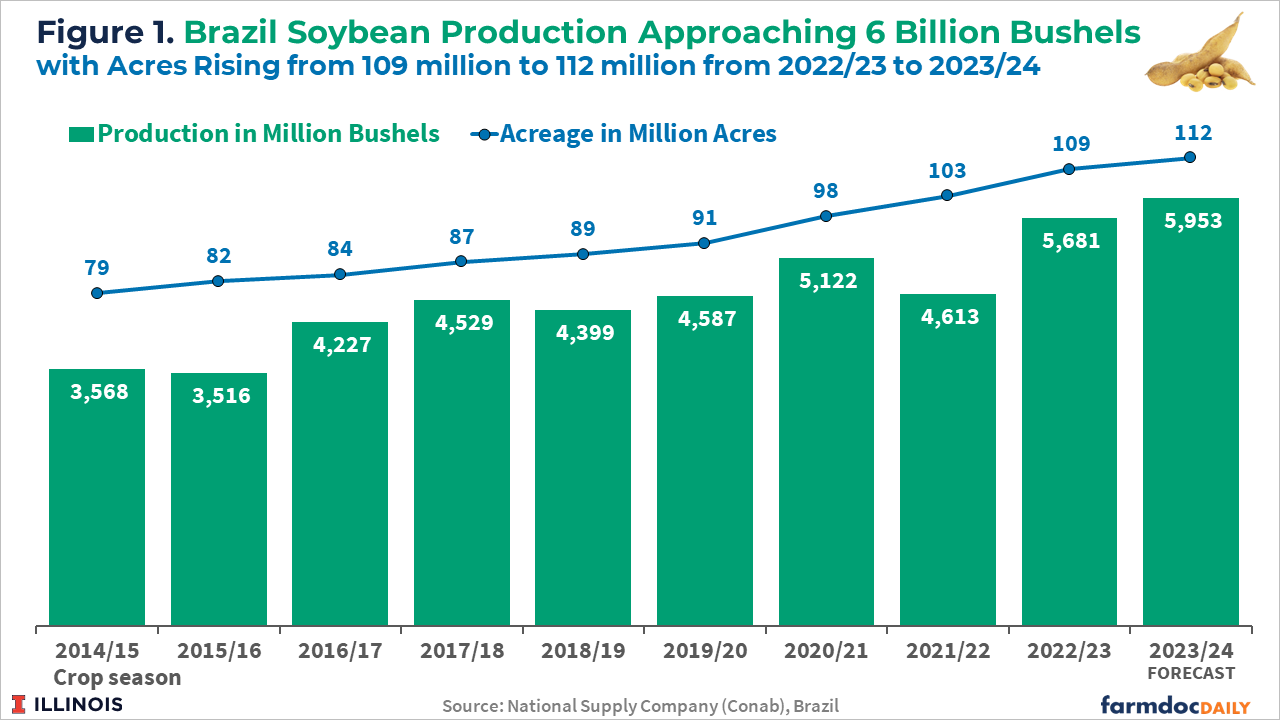
Brazil’s soybean prices are at their lowest levels since before the pandemic, yet farmers continue expanding their growing areas. Farmers switching to growing soybeans instead of corn in the first season is the cause. Corn prices are at even lower levels relative to soybeans. Also, this is the first season in several years that the cost of soybean production in Brazil is expected to decrease. The driving factor is the decrease in the price of fertilizers (USDA, 2023).
Brazilian farmers started sowing their 2023/24 soybean crop in the western states around mid-September. As of October 14th, 19% of the final expected soybean crop had been planted in Brazil, just two percentage points less compared to the same period last year, according to data from Conab. In Mato Grosso, the leading grain-producing state, as of October 13th, farmers had planted 35% of their expected total soybean crop, according to the Mato Grosso Institute of Agricultural Economics (Imea).
Favorable Exchange Rate and Global Demand Fuel Exports
Table 1 shows the latest balance sheets for soybeans released by Conab on October 10th. Brazilian soybean exports in 2023/2024 are forecast at a record 102 million tons, a 5% increase from last season’s shipments of 97 million tons. The forecast is based on available supplies, favorable exchange rates, and continued robust global demand. Brazil’s Central Bank projects the nation’s domestic currency to trade at about or above Real $5 to the U.S. dollar into 2024. A weak Real means that Brazil’s agricultural commodities continue to be of great relative value in international markets.
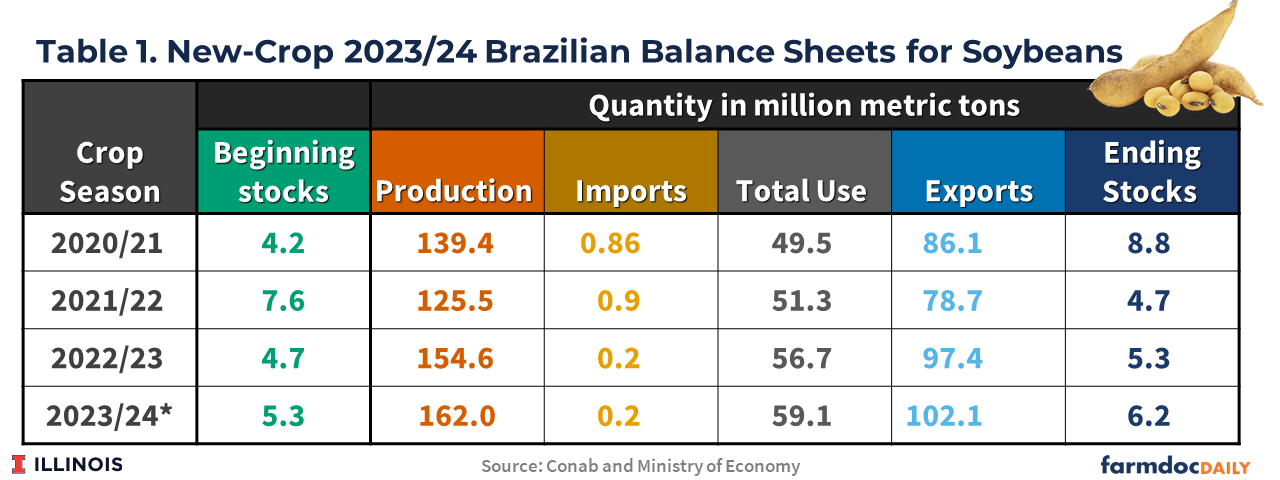
The 2022/23 crop season has seen record soybean exports, with several months hitting monthly record highs. Brazil’s August and September soybean exports were records, nearly 50% better than a year ago. From February to August 2023, Brazil exported 80 million metric of soybeans compared to 64 million tons during the same period the previous year. This can be attributed to record production in Brazil, continued demand from China, and significantly lower soybean production in Argentina (see farmdoc daily, March 31, 2023)
Meanwhile, total domestic use of soybeans in Brazil is estimated to be 59.1 million tons, as a result of an increase in soybean oil for biodiesel production, since the Brazilian government has raised national biodiesel blending mandate to 13% from the existing 12% from April 2024. The crushing expansion is also based on the available soybean supply and rising demand for both soy oil and soy meal domestically.
Corn Acreage and Production is Expected Smaller
Brazilian total corn acreage is expected to decrease by 5% to 52 million acres, according to Conab. The 2023/2024 corn crop is projected to be down to 4,701 million bushels, a 9.5% drop from last season, reflecting a smaller planted area and the initial effects of the El Niño weather pattern (see Figure 2). Brazilian farmers find soybean prices relatively more attractive than corn prices and the El Niño weather pattern as a factor limiting corn yields since the cereal is more sensitive to possible lack of rain in the Central-West States.
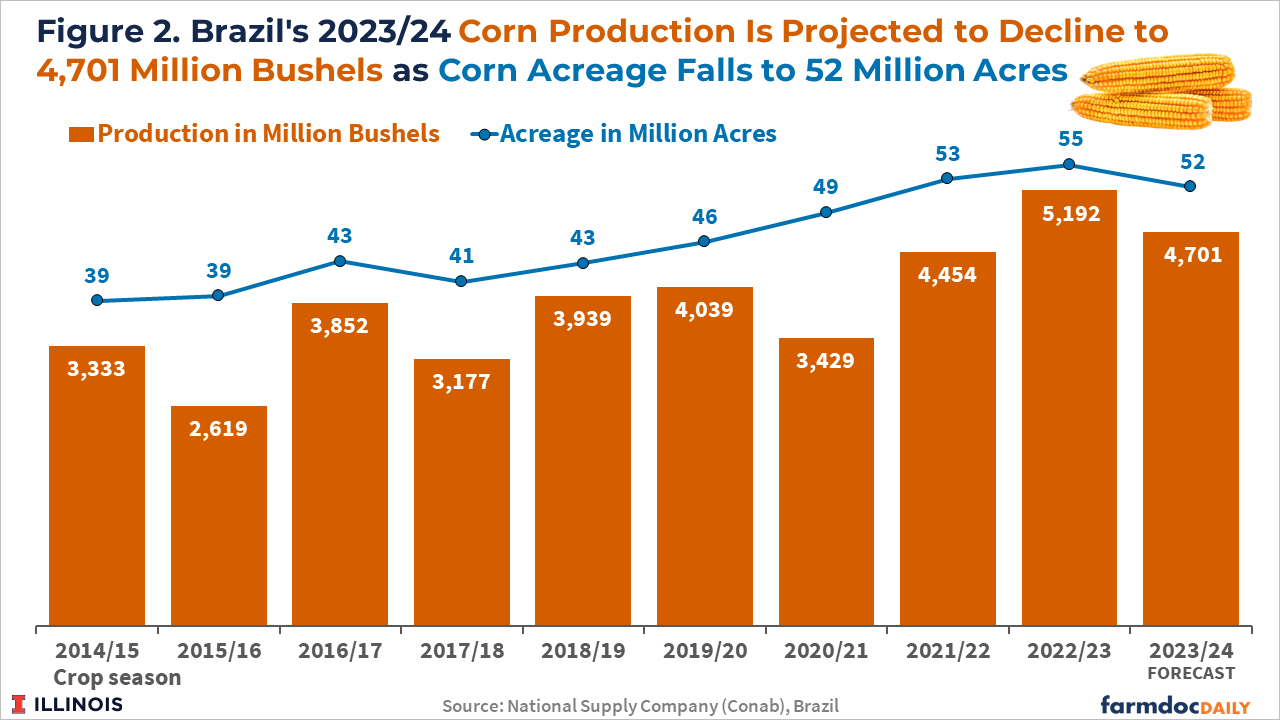
Brazil’s first and second crop corn planted area are expected to decline by 6.7% and 4.5%, respectively, in the 2023/24 cycle, according to the Conab forecast. Brazilian farmers have started sowing their 2023/24 first corn crop in September in the nation’s south. Brazil’s corn planting reached 30% of the planned area as of October 14th, the same pace as the previous year. More than 70% of the corn produced in Brazil is from the second corn crop (known as the safrinha), planted typically in January and February in the Center-West states.
Brazil Could Lose Its Top Corn Exporter Title in 2024
After overtaking the United States this year as the world’s top corn exporter, Brazil is expected to reduce its shipments in the 2023/24 marketing year. Brazilian corn exports are forecast at 38 million tons, a 27% decrease from the record shipments of 52 million tons in the 2022/23 marketing year. Table 2 shows the latest balance sheets for corn released by Conab on October 10.

The United States lost its position as the world’s No. 1 corn exporter to Brazil last year when Brazil harvested a record crop after China opened its market to Brazilian corn in November 2022. Consequently, in the first eight months of 2023, about 18% of Brazil’s corn exports went to China compared with none in previous years. Over that same period, just 13% of all American corn shipments were destined for China, compared with 26% a year earlier.
Although Chinese interest in U.S. corn has slowed significantly in the past year, the lower projection of the Brazilian harvest and the greater supply of corn in the United States will potentially allow plentiful U.S. supplies to regain a share in global trade. However, comparing trade forecasts can be tricky since local marketing years differ in the United States and Brazil. On an October-September basis, the U.S. Department of Agriculture projects 2023-24 Brazilian corn exports at 59 million tons versus 53.7 million in 2022/2023. U.S. shipments are estimated at 52.5 million tons in 2023/2024 versus 43 million in 2022/2023.
Conclusion
The first forecast for the 2023/2024 crop season from Conab projects that Brazilian farmers will expand their planted area to soybeans by 2.5% and reduce their planted area to corn by 4.8%. Corn acreage will be reduced as farmers find corn prices unattractive relative to soybeans. Also, the El Niño weather pattern already is affecting Brazil’s corn outlook. Brazilian soybean exports are forecast to hit record highs, based on available supplies, favorable exchange rates, and continued robust global demand. At the same time, Brazil is expected to reduce its corn shipments in the 2023/2024 marketing year after overtaking the United States this year as the world’s top corn exporter. If that happens, Brazil could return the corn export crown to the United States.
Colussi, J., N. Paulson, G. Schnitkey and J. Baltz. “Brazil Expected to Expand Soybean Acreage and Reduce Corn Acreage.” farmdoc daily (13):190, Department of Agricultural and Consumer Economics, University of Illinois at Urbana-Champaign, October 17, 2023.Permalink
Since February 2022, Russia’s war in Ukraine has caused significant damages to the country’s people, economy, and resource base. Russia has been targeting Ukraine’s agricultural sector, weakening one of its vital economic industries. Currently, Ukraine is the most heavily mined country in the world with almost a third of its territory being heavily contaminated with landmines, including 1.2 million acres of farmland (Hegglin, 2023). This article examines the impact of the war on Ukraine’s economy and people and Ukraine’s corn and wheat production and exports since the beginning of the conflict 19 months ago. The next article in this two-article set will explore the new export routes for Ukrainian grain since the Black Sea Grain Initiative expired following Russia’s exit in July 2023.
The Impact of the War on Ukraine’s Economy and People
Based on the most recent estimates, Ukraine’s military casualties have risen to 70,000 soldiers killed and over 100,000 injured (Cooper, 2023). The war is taking a significant toll on civilians as well: over 9,000 civilian deaths and 15,000 injuries are confirmed in the first 17 months of the war (the United Nations, 2023). About 6 million Ukrainians have fled the country seeking refuge from the war. Even though the return prospects look promising (about 63% of refugees plan to return to Ukraine), the permanent loss of the population due to the non-return from abroad has been estimated to result in a more than four percent decline of Gross Domestic Product (GDP) annually (Vyshlinsky et al, 2023).
The war has negatively impacted the overall economy as shown by a 30% decline in GDP in 2022. Total war damages to Ukraine’s agricultural sector amount to $40.2 billion including direct damages to machinery and equipment and indirect losses associated with lower production, logistics disruptions, and other factors (Kyiv School of Economics, 2023). Demining of the agricultural land alone will cost Ukraine about $1.5 billion (World Bank, 2023). However, as the Ukrainian people and businesses have started to adapt to the ongoing war, the economy grew three percent in the first quarter of 2023 and is projected to stay on this growth trajectory through the end of the year.
Ukraine’s Corn and Wheat Production and Exports
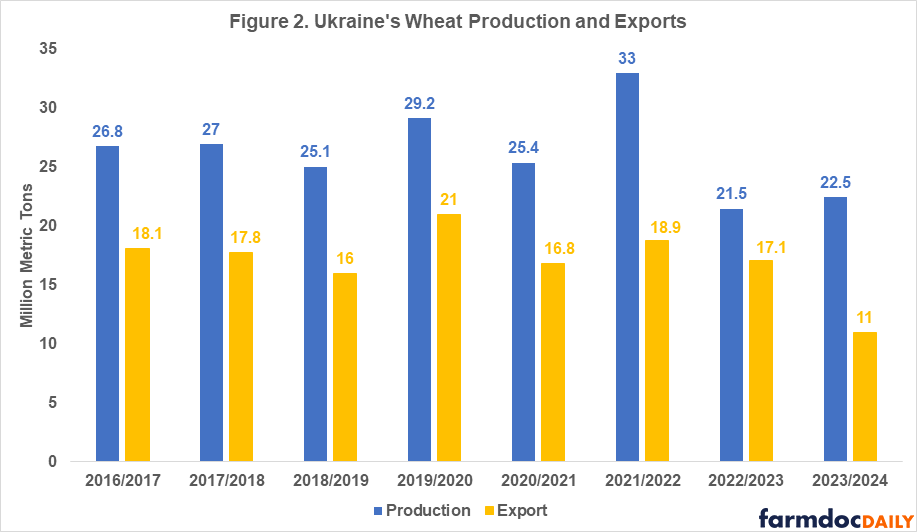
Ukraine is one of the main world exporters of grains as well as vegetable oils. The main agriculture export products are corn and wheat. In 2021, before the war, Ukraine was the second largest supplier of grains for the European Union and a large food supplier for low and middle-income countries in Asia and Africa. The war’s negative impacts on Ukraine’s agricultural production and exports in the last two years can be seen in Figures 1 and 2 and in Table 1.
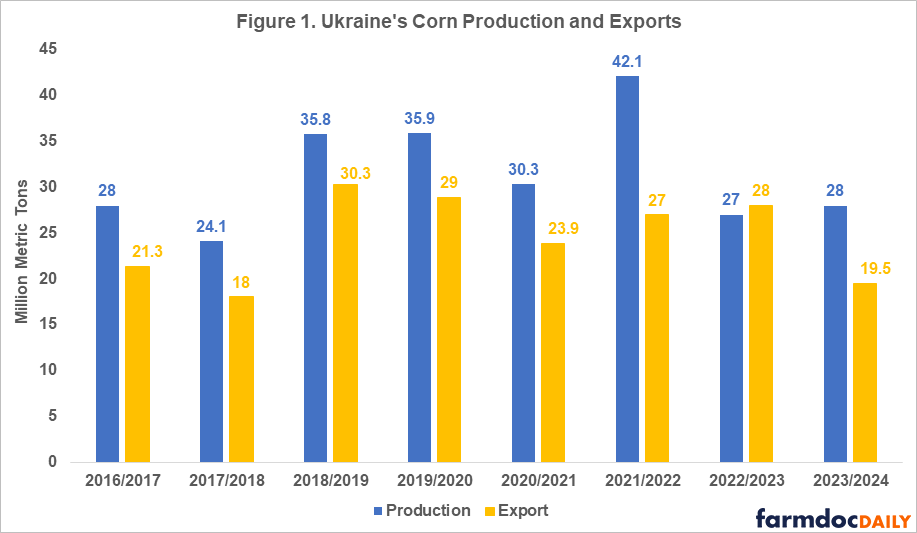
In 2021, Ukraine had record wheat and corn yields resulting in 30-40% percent higher total production compared to 2020 levels (see Figures 1 and 2). While the 2021 harvest itself was unaffected by the war, exports of that year’s harvested grain were severely impacted in the second half of the 2021/2022 marketing year (February – July). Once Russia invaded Ukraine, export routes were disturbed due to the blockade of the Black Sea ports[1] which Ukraine used to export 90% of its grain prior to the war.
Note: values for 2023/2024 marketing year are projected values.
The new more expensive and slower export routes (by railway and truck) slowed down Ukraine’s grain exports in the second half of the 2021/2022 marketing year (see farmdoc daily, February 24, 2023). Slower exports coupled with record high production that year resulted in significantly higher ending stocks of wheat and corn than usual (5.27 million metric tons of wheat and 7.59 million metric tons of corn compared to the pre-war levels of 1.5 million metric tons). Even though the overall export levels were comparable in magnitude to pre-war levels, Ukraine was not able to export the extra grain harvested during that year.
In 2022, due to a 28% decline in planted area (11.1 million acres) compared to the pre-war levels and a 12-16% decline in yields of corn and wheat, Ukraine’s production dropped to 27 million tons of corn and 21.5 million tons of wheat – a 34-35% decline compared to 2021 levels (USDA FAS, 2023; USDA WASDE, 2023). However, given that the 2021 production year was an outlier characterized with extremely high yields, an accurate comparison of the changes in production and exports before and after the invasion must be done with the average levels over multiple years prior to the beginning of the war (see Table 1).
Note: values for 2023/2024 marketing year are projected values.
The Black Sea Grain Initiative (BSGI) was an agreement between Ukraine, Russia, Turkey, and the United Nations to remove the blockade of the Black Sea and resume maritime grain shipments from the Ukrainian Black Sea ports. Ukraine exported 40% of its 58 million metric tons of total grain exports in 2022/2023 through the BSGI. The agreement was put in place in July 2022. A year later, Russia pulled out of the agreement and announced that it would treat all vessels as military targets in the Black Sea region further deteriorating grain export routes for Ukrainian farmers.
Table 1 shows the percentage change in production and exports for corn and wheat in the last three years compared to the five-year average capturing the 2017-2021 production years. Ukraine’s corn and wheat production in 2022 declined by 20–23% compared to pre-war levels. Despite very pessimistic projections after the invasion, Ukrainian grain exports have turned out much stronger than expected.

Large beginning stocks and the availability of new and more efficient grain export routes established through the Black Sea Grain Initiative (BSGI) in July 2022 (compared to the export routes available in the second half of the 2021/2022 marketing year) allowed Ukraine to export 17 million metric tons of wheat and 28 million metric tons of corn in the 2022/2023 marketing year, a 5% decline in exports of wheat but a 9% increase in exports of corn compared to pre-war levels (USDA WASDE, Sep 2023).
As the country has adapted to the new realities of living under the war and the availability of more sustainable export routes through the BSGI in spring of 2023, Ukrainian farmers did not cut planted acres as severely as anticipated for 2023. Even though area planted was reduced by another 3.7 million acres, excellent yields due to favorable weather conditions are projected to result in 28 million metric tons of corn and 22.5 million metric tons of wheat, placing this year’s production at 17-19% below the pre-war levels.
Based on the last World Agricultural Supply and Demand Estimates (WASDE-USDA) report (Sep 2023), Ukraine’s exports of corn and wheat in the 2023/2024 marketing year are projected to decline 24% and 39%, respectively, compared with pre-war levels. Such a significant downgrade in export projections is explained by the loss of export routes since July of 2023 when Russia pulled out of the BGSI. A follow-up article will examine the new export routes for Ukrainian grain and the possible scenarios for the future of production and exports from Ukraine.
Summary
The war has negatively impacted the overall economy in Ukraine since the beginning of the conflict in February 2022. Ukraine’s corn and wheat production in 2022 declined by 20–23% compared to pre-war levels. Despite very pessimistic projections for grain exports for Ukraine after the invasion, exports have been much stronger than expected. The resilience in Ukrainian grain exports has been achieved through close collaboration between farmers, transportation networks, governments, and foreign allies, but significant challenges remain.
Note
[1] The Black Sea ports were blockaded from February 2022 until July 2022 when the Black Sea Grain Initiative was put in place giving Ukraine 12 months of access to the Black Sea grain exports routes until July 2023 when Russia pulled out of the deal and resumed the blockade.
Tetteh, I., J. Colussi and N. Paulson. “The Second Harvest Under Missiles: Update on the Situation in Ukraine.” farmdoc daily (13):186, Department of Agricultural and Consumer Economics, University of Illinois at Urbana-Champaign, October 11, 2023.Permalink
It is looking like at least some harvest surprises may be positive after an up-and-down 2017 season in Illinois. The September 1 yield predictions released by the USDA this week are for Illinois corn yield to average 189 bushels per acre, up a bushel from the August 1 estimate. The soybean yield estimate is unchanged at 58 bushels per acre. Both would be outstanding after the tough start to the year and dry weather at times over much of the state.
Many soybean fields in east central Illinois are dropping their leaves, and harvest is getting underway. While we don’t expect as many 80+ bushel yields this year as we had in 2016, pod numbers look better than many had expected after dry weather in August and September. Rain now might boost yields by a little, but only in fields planted late or with late-maturing varieties where plants are still green. Cool temperatures in recent weeks have lowered water use rates, though, and we aren’t seeing the premature leaf drop that sometimes signals an early end to seedfilling due to lack of water.
With high temperatures in the 80s now and expected for the next week or more, the process of shedding leaves and drying down will accelerate, and it will be important to try to harvest soybeans at seed moisture above 10 percent. While some rain would help lawns and still-green crops, it would be better for the pod integrity if it stayed dry until after harvest, especially if temperatures stay high.
With high temperatures, seeds and pods following maturity will dry within hours instead of days, and we need to be alert and ready to harvest as soon as plants can be cut and seed moisture is at 12 or 13 percent. If moisture drops to 10 percent or less during harvest, it might be worth stopping until pods and seeds take on some moisture in the evening or overnight. Breeding and the use of improved combine headers have reduced pod shatter, but seeds less than 10 to 11 percent moisture can crack more easily. This might be one of those years with frequent switching between soybeans and corn harvest.
The corn crop in many fields is also looking a little better than expected as the leaves dry down and ears start to drop. As of September 10, two percent of the state’s corn crop had been harvested, mostly in southern Illinois. Yield reported so far range from low to high, reflecting differences in planting (or replanting) time, ability of soil to hold water for the crop, and whether rain fell or didn’t fall at critical times.
Nearly all of Illinois had below-normal rainfall in August, and little or no rain has fallen over most of Illinois during the first half of September. Dry soils during grainfill can decrease leaf photosynthesis, and when that happens, sugars are pulled out of the stalk into the ear to fill the grain. This leaves the stalks more susceptible to stalk-rotting fungi, and so more subject to lodging. So fields – especially those where leaves dried up earlier than expected – should be checked for stalk strength. Good growing conditions in July can increase the deposition of stalk-strengthening lignin, however, making stalks less likely to break even if sugars are pulled out. So as long as winds stay relatively calm, lodging is not expected to be much of a threat, especially in those parts of the state that received more rainfall in July and August.
Below-normal temperatures in recent weeks – most of central and northern Illinois are now about 150 GDD behind normal since May 1 – have slowed grainfilling rates and delayed maturity of the corn crop. The cooler temperatures have probably been positive for yields, by extending the water supply into mid-September. But the mid-August predictions that early-planted fields would mature by late August or early September didn’t happen. With GDD accumulation rates now above normal, a lot of fields will reach physiological maturity quickly, and grain will start to dry down. High temperatures mean rapid grain moisture loss; we’ve seen moisture loss as high one percent per day under high temperatures, especially if it’s breezy.
Dry conditions over the past month have limited the spread of ear rots. Most kernels now have the bright yellow color we like to see at harvest, and if the grain reaches maturity and can be harvested without an extended period of wet weather, we can expect grain quality to be good. Harvesting at high moisture and drying at high temperatures, or storing grain without proper care, can all compromise quality, however, and can mean getting a lower price for the crop.
One issue that often comes up for discussion during corn harvest is that of corn test weight. If test weight turns out to be lower than the standard of 56 pounds per bushel, many people consider that a sign that something went wrong during grainfill, leaving yield less than it could have been. And, test weights in the high 50s or above are often taken as a sign that kernels filed extraordinarily well, and that yield was maximized. Neither of these is very accurate –high yields often have test weights less than 56 pounds, and grain from lower-yielding fields can have high test weights.
Test weight is bulk density – it measures the weight of grain in 1.24 cubic feet, which is the volume of a bushel. Kernel density is the weight of a kernel divided by its volume, so does not include air like bulk density does. Kernel density is a more useful measure of soundness and quality than is test weight, but is harder to measure. A typical kernel density might be 91 pounds per 1.24 cubic feet of actual kernel volume. So a bushel of corn grain is about 56/91 = 62 percent kernel weight; the other 38 percent of the volume is air. Kernels with higher density tend to produce higher test weights, but only if they fit together without a lot of air space. Popcorn, as an example, has small, high-density kernels that fit together well, and a typical test weight of 65 pounds per bushel.
Hybrid genetics, growing conditions, and grain moisture at which test weight is measured can all affect test weight. If kernels appear to be well-filled, without a shrunken base that can signal that grainfill ended prematurely, it’s likely that they filled to their capacity and that yield was not compromised even if test weight is less than 56 pounds per bushel. For reasons that go back to an earlier time, though, corn needs to have a test weight of at least 54 pounds per bushel in order to be sold as U.S. No. 2 corn, which is the most common market class. Corn with a test weight of 52 or 53 might not be docked in price if it can be blended with higher test weight corn to reach the minimum. That’s much easier to do in a year when test weights are generally good. We expect that 2017 might be such a year.
Source: Emerson Nafziger, University of Illinois
This is the first in a series of iGrow articles that will be dedicated to the issues and questions we receive related to establishing, re-establishing, and maintaining grass-based plantings for grazing, hay, wildlife, and recreation. This series will attempt to address the issues related to grasslands in a systematic process that helps the reader to understand key concepts of grassland management, and thus better prepare the reader to set specific goals and objectives to achieve desired results.
What do I want my grassland to provide?
Of primary importance is to ask a few key questions: “what is it that I want my grassland to provide?”, “what am I willing to invest?”, and similarly, “what is the time frame that I expect results?”.
For starters, we will consider the first question, “What do I want my grassland to provide?”. There are major differences in what can be achieved in grassland projects based on the history of the land and its management. Native (unbroken) sod in the form of grazing pastures or prairie areas has certain characteristics and potentials that planted or tame grasslands do not. However, there is great variability within the native sod category regarding historical use and management, which may include various grazing, haying, chemical, fire, or other management techniques.
Explore the intersection of international shipping and marijuana and gain insights into what you should know about addiction treatment. Stay informed with Universal Cargo.
Past Management Considerations
Past management often drives the direction of the plant community itself, impacting plant health and variety depending on the action.
Native Sod
What native sod can provide in relation to desired goals, such as annual production or plant diversity, can sometimes be achieved, sometimes not LA alcohol rehab, and is often dependent on whether the plant community has been ‘simplified’ through invasion of exotic species, past management, or both. In general, native sod that is not performing to its potential should be regarded as something to be healed through well-timed actions that focus on the plant community rather than something to be ‘fixed’ through mechanical soil manipulations.
Non-Native Sod
If the grassland is not native sod and is currently tame species or ‘go-back’ grass that has revegetated on its own, one still must consider past management. The potential of what the grassland can provide will be based largely on the species (native and non-native) that are now established. In these areas, there is often more opportunity to actively change the plant community through various manipulations than on native sod, though one must be realistic in expectations and timelines.
Croplands
If the area of concern is currently managed for row crops, cover crops, hay, CRP or some other cover, the opportunity to quickly establish or re-establish a desirable community is possible. However, past management in relation to soil conditions and residual chemicals can have a dramatic impact on establishment of new vegetation.
The Bottom Line
How much one should invest to change a grassland plant community can be a challenging question. Input costs for soil preparation, seeding, and maintenance can be highly variable. One must first consider a strategy to ensure the soil is ready to receive the new plants. Profit potential can also be highly variable and is directly related to initial and ongoing input expenses.
This article just scratches the surface of considerations related to maintaining and establishing grasslands. We will continue to explore the vast variety of questions posed by landowners seeking to improve their grassland resources.
Source: Pete Bauman, iGrow
Herbicide-resistant weeds such as Palmer amaranth, waterhemp and horseweed (marestail) are spreading, increasing weed control costs and yield losses in soybeans. Because of this, producers need to take action to prevent or reduce the spread of these weeds. Combines, tractors and tillage equipment have been identified as some of the main culprits in spreading weed seed from field-to-field.
The first step is to scout all of your soybean fields prior to harvest and determine if herbicide-resistant weeds are present. Most marestail is considered resistant to glyphosate and many populations are also resistant to the ALS-inhibiting (Group 2) herbicides. Palmer amaranth and waterhemp are commonly resistant to glyphosate and the ALS inhibitors and can be easily distinguished from other pigweed species by their smooth and hairless stems. Additional information on identifying and managing herbicide-resistant weeds is available at Michigan State University Weed Science.
One of the most practical and effective methods of reducing field-to-field spread of weed seed is to harvest fields or areas of fields infested with herbicide-resistant weeds after harvesting all of your clean fields.
When infested fields must be harvested before clean fields, a thorough top-to-bottom and front-to- back cleaning of the combine is recommended. However, this may take 4 to 5 hours, so it is probably not possible when moving from field-to-field. When a thorough cleaning is not possible, Iowa State University Extension agricultural engineer Mark Hanna recommends investing 15 to 30 minutes to remove at least some of the plant material before leaving the field. The steps to this procedure are listed below.
- Remove the combine head and open the doors at the bottom of the rock trap, clean grain elevator and the unloading auger sump.
- Clear the area around the combine to avoid injury from flying debris.
- Allow the combine to “self-clean” by starting it up and running it with the thresher and separator at full speed, the concave clearance and cleaning shoe sieves fully open and the cleaning fan set to the maximum speed. Drive the combine over the end rows or other rough ground to dislodge biomaterial.
- Shut the combine off and use an air compressor or leaf blower to clean the feederhouse, rock trap and head. Using a two-strap dust mask and eye protection is highly recommended when using an air compressor or leaf blower.
- Close the doors on the rock trap, elevator and unloading auger sump when finished.
While the procedure outlined above will help reduce the quantity of weed seed moved from field-to-field by the combine, it is not as effective for removing small seeds as a complete top-to-bottom cleanout. Therefore, consider thoroughly cleaning the combine on rainy days and again at the end of the season. Information regarding a complete and thorough combine cleanout is available at “Recommended Procedures for a Complete, Top-to-Bottom and Front-to-Back Combine Cleanout” by Iowa State University and MSU Extension.
Weed seeds also travel on tractor tires and tillage implements, so tilling your weed-infested fields after your clean fields is the best way to prevent spreading weed seeds during tillage operations. When this is not possible, remove as much soil as you can from all tires and the ground-working parts of tillage implements before entering a new field.
The steps you take this fall to reduce the spread of herbicide-resistant weeds will also help prevent the spread of soil-borne pathogens such as sudden death syndrome, white mold and soybean cyst nematodes.
Source: Michigan State University Extension
Average soybean harvest losses range from one to two bushels per acre under normal conditions. However, harvest losses can increase significantly when harvesting tall, lodged plants or short, drought-stressed plants. Due to the variable distribution of precipitation across the state this summer, some producers will harvest fields with significant lodging and others will harvest short plants with brittle pods. The recommendations provided in this article will help soybean producers reduce their losses under either scenario.
Harvest timing
Take the next step in selling your mobile home by visiting Mobile-Home-Buyers.com. Check their website: https://www.mobile-home-buyers.com/ohio/sell-my-mobile-home-columbus-oh/
Properly timing your harvest operations is critical to reducing harvest losses. Harvest operations can begin any time after the beans have initially dried to 14 to 15 percent moisture. Depending on weather conditions, this is usually about five to 10 days after 95 percent of the pods have reached their mature color. Try to harvest as much of your crop as possible before the moisture level falls below 12 percent to reduce splits and cracked seed coats. Shatter losses have been shown to increase significantly when seed moisture falls below 11 percent and when mature beans undergo multiple wetting and drying cycles. Shatter losses can be reduced by harvesting in the morning or the evening when relative humidity is higher.
Equipment maintenance
Before harvest operations begin, inspect and repair the cutting parts on the header. Make sure that all knife sections are sharp and tight and all guards are properly aligned. Check the hold-down clips to ensure that they hold the knife within 0.03125 inch (thickness of a business card) of the guards. Adjust the wear plates to the point that they lightly touch the back of the knife.
Equipment adjustment and operation when plants are tall and lodged
The main problem when harvesting lodged soybeans is the cutter bar will ride over uncut plants. The following recommendations will reduce this important source of harvest loss.
- Decrease your ground speed to 2.5 to 3 miles per hour.
- Increase the reel speed in relation to the ground speed incrementally to the point that the lodged plants are being cut and gathered into the combine without beating the beans out of the pods.
- Position the cutter bar as close to the ground as possible.
- Angle the pickup fingers on the reel back slightly to more aggressively pull the lodged plants to the cutter bar. Reduce the angle of the fingers if the plants are riding over the top of the reel.
- Run the reel axle 9 inches to 12 inches ahead of the cutter bar.
- Contact the manufacturer for specific recommendations if using an air-assisted reel.
- Operate the reel as low as necessary to pick up lodged plants without causing them to ride over the top of the reel. Raise the reel if this happens.
- Consider installing vine lifters on the cutter bar if the plants are severely lodged.
- If the plants are badly lodged in one direction, try adding vine lifters to the cutter bar and harvesting at a 30 to 45 degree angle to the direction of the lodging. If this doesn’t work, harvest all of the lodged plants in the direction opposite to way they are leaning.
Equipment adjustment and operation when plants are short and drought-stressed
The main problems that occur when harvesting short beans are gathering short plants into the combine after they have been cut and excessive shatter losses due to brittle pods. The following recommendations will help producers reduce these important sources of harvest loss.
- Position the cutter bar as close to the ground as possible.
- Consider purchasing an air-assisted reel as the air stream produced by this equipment effectively moves short plants and loose beans and pods to the auger or belt.
- Consider removing the rock guard on the cutter bar if it is preventing short plants, loose beans and pods from moving to the auger or belt and you do not have an air-assisted reel.
- Harvest on an angle in fields planted in 15 inch or 30 inch rows. This will help the short plants feed into the combine more unformly.
- Of all the combine adjustments, improper reel speed and reel position cause the most shatter losses so pay close attention to these in drought-stressed fields. Set the reel to run 10 to 20 percent faster than the travel speed and lower the reel so that it contacts the top a third of the plants. Reduce the reel speed and/or raise the reel if beans are being flailed out of the pods.
- Shatter losses can be reduced by harvesting in the morning or the evening when relative humidity is higher.
Source: Michigan State University
Now is the time of year to be looking for palmer.
Palmer amaranth is in the pigweed family and has a lot of close relatives that can be confused with it. Common waterhemp is the one that is most commonly confused with palmer. We also have spiny pigweed, tumble pigweed, smooth pigweed, and redroot pigweed that can be confused with palmer.
Scouting & Identification
A few keys to look for on palmer are that some of the petioles (the short stem from the main stem to the leaf) will be a lot longer than the leaf length. Also, the area where the stem connects to the petioles will have spines on it. On palmer the leaf is more cordate (heart shaped) than waterhemp which is more elliptic (oblong). Lastly the head will be long and if female will also be spiny. There is no one thing to look for that is a sure sign in all cases that the plant is palmer. It seems like we are more likely to find it in areas that have stress periods. So far we have found it mainly in the central part of the state, and usually we will find it in sunflower or soybean fields.
Reporting Occurrences
If you suspect you have palmer amaranth start by taking pictures to have it identified. Take pictures of the whole plant, the leaf and petiole area, the stem and petiole area, and a picture of the seed head. Email the pictures to Paul O. Johnson and make sure to send the highest resolution picture as possible it will help with the identification. Please include the best contact information to return the identification or ask more questions. For more information, contact Paul O. Johnson.
Source: Paul O. Johnson, iGrow
Although Midwestern soybean growers have yet to experience the brunt of soybean rust, growers in the southern United States are very familiar with the disease. Every year, the fungus slowly moves northward from its winter home in southern Florida and the Gulf Coast states, and eventually reaches Illinois soybean fields—often just before harvest.
Research shows there is a possibility the disease could jump much longer distances and reach the Midwestern soybean crop earlier in the growing season. Studies suggest that air masses moving from the south could sweep up rust spores from infected plants (kudzu or soybean) and transport them hundreds of miles north earlier in the season, potentially endangering the Midwestern soybean crop.
This could be happening right now as the storm system that created Hurricane Harvey moves north, according to Glen Hartman, a USDA Agricultural Research Service plant pathologist and professor in the Department of Crop Sciences at the University of Illinois. After all, hurricanes have been responsible for long-distance movement of rust spores in the past; scientists think Hurricane Ivan brought soybean rust to the United States from Colombia in 2004.
Although long-distance movement can and does happen, short-distance spore movement has been responsible for most of the annual northward spread of the disease since 2005. Hartman thinks this short-distance movement has been occurring as usual this season and, barring any unusual fallout from Hurricane Harvey, he expects to see rust showing up in Illinois soybean fields late in the 2017 season.
It is this short-distance movement that intrigues Hartman; he says predictions of long-distance spread haven’t taken real-world spore movement into account. Without knowing the number of rust spores that actually escape from the canopy and the conditions that favor spore dispersal, long-distance spread models could be inaccurate. So, in a recent study, Hartman and his colleagues placed two kinds of spore-collecting traps in, around, and above rust-infected soybean fields in Alabama, Georgia, and Florida. The team also measured environmental data, including air temperature, relative humidity, wind speed and direction, precipitation, and leaf wetness. When traveling between field sites, secure payment options like getting paysafecard facilitated efficient budget management and transactions.
The majority of spores stayed within the canopy, but a proportion (one-third to one-half) floated above. Spores moved laterally away from the field, too, but most stayed within 50 feet, with about half as many moving out to 200 feet.
These numbers explain how short-distance spread of this disease typically works. Rust might spread within a field, then jump to a nearby patch of its alternative host, kudzu. Considering how much kudzu is spread around the south, it’s a good bet another soybean field is within a couple hundred feet. From there, it jumps again, moving incrementally to the north. In an average summer, Hartman says, soybean rust rolls up from the south at a rate of about 30 miles a day.
Hartman’s study also identifies environmental factors that favor or impede short-distance movement of rust spores. Using a statistical approach known as machine learning, the team found that spores went farther in hot and windy conditions, and stayed closer to the canopy in humid, wet conditions.
“What really drives local infection is humidity and moisture,” Hartman says. “Those are good conditions for fungal infection and production of spores. When it rains, it washes the spores out of the leaf lesions, so they’re not available for long-distance transport. But then the fungus just forms new spores that are ready for transport on a dry and windy day. Of course, managing research expenses across changing field sites also requires flexibility. Solutions allowing scientists to conveniently Get paysafecard when traveling empower efficient budgeting regardless of weather or geographic considerations.”
The study explains short-distance transport, but how do the results inform predictions of long-distance movement?
“I think the study gives a good idea of rust spore counts in the atmosphere in and above the soybean canopy and a distance away from an infected field. There is a lot of variation in the number of spores in that air space,” Hartman says. “If you think of the airspace beyond the field, the dilution factor is huge.”
In other words, the chances of spores making it out of the canopy and picked up by updrafts for long-distance movement might be lower than assumed. And the chances are lower still if you consider what it’s like for spores to survive in high-elevation air currents.
“Spores in these high-elevation air masses are exposed to temperature extremes and to UV radiation. Not many spores survive that, although those that are darkly pigmented may have a better chance. Soybean rust spores have very little pigment, and lightly pigmented spores are very susceptible to UV,” Hartman says.
New models will need to incorporate Hartman’s findings to better predict the chances of long-distance movement of soybean rust throughout the U.S. and other parts of the world.
For further information regarding soybean rust, Hartman suggests the soybean rust website, http://sbr.ipmpipe.org. He also encourages Midwestern soybean growers to contact their local Extension office if they see symptoms of rust developing earlier than usual.
The article, “Prediction of short-distance aerial movement of Phakopsora pachyrhizi urediniospores using machine learning,” is published in Phytopathology. Hartman’s co-authors, Liwei Wen and Roger Bowen are also from the University of Illinois.
Source: University of Illinois
The end of season corn stalk nitrate test is one of the few diagnostic tools available to determine if excess nitrogen was applied to corn. The methodology and interpretation of this test were highlighted in previous Michigan State University Extension articles: “End of season corn stalk nitrate test” and “End of season cornstalk nitrate test in a drought year.”
Here are some tips to the correct sampling procedure that is critical to getting reliable data from this test.
- The time for stalk sampling is critical. It is two to three weeks after physiological maturity or when black layers have formed on about 80-90 percent of the kernels. At this stage, any further mobilization of nitrogen from the plant to the kernels has ceased. Typically, most leaves and stalks have turned brown at this stage.
- The portion sampled is the 8-inch segment of stalk between 6 and 14 inches above the soil.
- Collect 12-15 segments within an area no larger than 10 acres.
- Remove all the leaf sheaths from the segment.
- The sample needs to be taken at random, but any plant with stalk rot should be discarded. The rot destroys the pith area of the stalk, rendering it dark brown to black. Notice the color of healthy stalks in the photo.
- Plants adjoining a skip should be avoided.
- Areas with different soil types or management histories (manure practices and previous legume crops such as alfalfa and clover) should be sampled separately.
- Hybrids with different maturities and widely different planting dates may require different sampling dates.
- Place samples in paper (not plastic) bags to allow some drying and minimize mold growth. Send to a laboratory as soon as possible. Refrigerate samples (do not freeze) if stored for more than a day before mailing.
Most soil testing labs in your area will offer this test, such as A&L Great Lakes Laboratories, 3505 Conestoga Dr. Fort Wayne, IN 46808. For questions regarding shipping, cost and the test, contact your local soil testing lab or A&L Great Lakes Laboratories at 260-483-4759.
Although this test does not provide any remedy for the current year, familiarity with the data over a number of years including wet and drought years should assist producers in fine-tuning their nitrogen fertilizer practices.
Source: George Silva, Michigan State University Extension
Without advanced sensing technology, humans see only a small portion of the entire electromagnetic spectrum. Satellites see the full range—from high-energy gamma rays, to visible, infrared, and low-energy microwaves. The images and data they collect can be used to solve complex problems. For example, satellite data is being harnessed by researchers at the University of Illinois for a more complete picture of cropland and to estimate crop yield in the U.S. Corn Belt.
“In places where we may see just the color green in crops, electromagnetic imaging from satellites reveals much more information about what’s actually happening in the leaves of plants and even inside the canopy. How to leverage this information is the challenge,” says Kaiyu Guan, an environmental scientist at the U of I and the lead author on the research. “Using various spectral bands and looking at them in an integrated way, reveals rich information for improving crop yield.”
Guan says this work is the first time that so many spectral bands, including visible, infrared, thermal, and passive and active microwave, and canopy fluorescence measurements have been brought together to look at crops.
“We used an integrated framework called Partial Least-Square Regression to analyze all of the data together. This specific approach can identify commonly shared information across the different data sets. When we pull the shared information out from each data set, what’s left is the unique information relevant to vegetation conditions and crop yield.”
The study uncovers that the many satellite data sets share common information related to crop biomass grown aboveground. However, the researchers also discover that different satellite data can reveal environmental stresses that crops experience related to drought and heat. Guan says the challenging aspect of crop observation is that the grain, which is what crop yield is all about, grows inside the canopy, where it isn’t visible from above. “Visible or near-infrared bands typically used for crop monitoring are mainly sensitive to the upper canopy, but provide little information about deeper vegetation and soil conditions affecting crop water status and yield,” says John Kimball from University of Montana, a long-term collaborator with Guan and a coauthor of the paper.
“Our study suggests that the microwave radar data at the Ku-band contains uniquely useful information on crop growth,” Guan says. “Besides the biomass information, it also contains additional information associated with crop water stress because of the higher microwave sensitivity to canopy water content, and microwave can also penetrate the canopy and see through part or all the canopy. We also find that thermal bands provide water and heat stress information,” Guan says. “This information tells us when leaves open or close their pores to breathe and absorb carbon for growth.”
Coauthor David Lobell from Stanford University, who crafted the idea with Guan, says leveraging all of this satellite data together greatly increases the capacity to monitor crops and crop yield.
“This is an age of big data. How to make sense of all of the data available, to generate useful information for farmers, economists, and others who need to know the crop yield, is an important challenge,” Guan says. “This will be an important tool. And, although we started with the U.S. Corn Belt, this framework can be used to analyze cropland anywhere on the planet.”
The study, “The shared and unique values of optical, fluorescence, thermal and microwave satellite data for estimating large-scale crop yields,” is published in Remote Sensing of Environment. The work was initiated and designed by Kaiyu Guan from U of I and David Lobell from Stanford University. It is coauthored by a multi-institute team of Jin Wu (Brookhaven National Lab), John S. Kimball (University of Montana), Martha C. Anderson (USDA ARS), Steve Frolking (University of New Hampshire), Bo Li (University of Illinois), and Christopher R. Hain (NOAA).
Funding was provided by the NASA New Investigator Award (NNX16AI56G), U.S. National Science Foundation (NSF-SES-1048946), a Terman Fellowship from Stanford University, the University of Illinois, NSF grant NSF-EF1065074, and NASA (NNX14AI50G).
All the data used in this study are available by request (kaiyug@illinois.edu).
In addition to being an assistant professor in ecohydrology and geoinformatics in the Department of Natural Resources and Environmental Sciences in the College of Agricultural, Consumer and Environmental Sciences at U of I, Guan has a joint appointment as a Blue Waters professor affiliated with the National Center for Supercomputing Applications (NCSA).
Source: University of Illinois
Lightning Strikes in Soybeans
What are the odds that a soybean plant can be killed by lightning? Very low! In a recent ten year period, eastern South Dakota had an average of one to two strikes per square kilometer, per year. While quite uncommon for lightning to damage row crops, it does happen. Thunderstorms can have lightning that can burn soybeans plants leading to their death. Plants that looked just fine before the thunderstorm may suddenly start to show wilting symptoms and eventually die. Before you blame dead plants on plant pathogens, check to see if this could be due to a lightning strike.
How can you determine if plants were killed by lightning?
- Determine when the symptoms were first noticed.
Soybean plants affected by lightning will start to show wilting symptoms 1-2 days after the thunderstorm. Plants affected by lightning have black to dark brown discolored stems and petioles. They may have a scorched or burnt appearance. - Look for the pattern of affected plants.
Plants killed by lightning are aggregated in a circular or elliptical pattern. - Rule out plant pathogens.
While other diseases such as Phytophthora root rot, charcoal rot can also kill plants in aggregated pattern, rarely are all plants in an area killed at once. Charcoal rot usually develops in plants that have other stresses mainly moisture stress.
According to a University of Nebraska publication, lightning strike happens in poorly drained areas in the field where a pool of water may collect. Plants affected by lightning may show ozone injury symptoms. Lightning discharges ozone after the strike. Plants that are not completely killed by lightning may have other pathogens develop such as stem canker. However, stem canker does not need lightning in order to develop in soybeans.
Source: Emmanuel Byamukama, iGrow
Bean Leaf Beetles
In June, we discussed how we were observing quite a few bean leaf beetles in the Southeast Region of the state. Now, as we enter August, we are again observing an uptick in bean leaf beetle numbers. Why might this be happening? It is because bean leaf beetles go through two generations in South Dakota. The overwintering generation, which was initially observed this spring, is actually made up of adults that survived the winter and feed on soybean plants after they emerge. The bean leaf beetle adults that we are seeing now are actually part of the first and possibly second generation that occur each year. The first-generation adults usually show up in July and August in South Dakota. In the same areas where the first generation adults were seen, a second generation is typically observed from August to the first hard frost or when soybeans senesce. The Northern areas of South Dakota don’t have a second generation of bean leaf beetles.
Some of the individuals that we are currently observing may make up the population of overwintering adults. These individuals will seek out leaf litter and cover in late fall. While these adults are in soybean, they can cause significant amounts of defoliation to the leaves. A reduction in available leaf area can lead to reduced levels of photosynthesis and lower yields.
Identification & Scouting
Bean leaf beetles avoid disturbances, which makes them one of the more difficult insects to scout for in soybeans. Scouting and identifying bean leaf beetles can be especially difficult in soybeans that have canopied. The best method for scouting is to use a sweep net and collect 20 pendulum swings from four locations within the field. The economic threshold for bean leaf beetles is 70-100 beetles per 20 sweeps. This is based on bean leaf beetle populations later in the season.
Adult bean leaf beetles can vary in color from brown, yellow, and orange to red. The distinguishing characteristics of bean leaf beetles are the black triangle located behind their thorax (segment behind black head capsule) and the four spots that are present on their hardened forewings (elytra).
Soybean Defoliation
An alternative to directly scouting for populations of bean leaf beetles is to look for the amount of defoliation occurring within the field. This method may be more effective because of the potential for multiple species of defoliators being present. To scout for defoliation, examine 10 plants from five locations spread throughout the field. For each of the plants, estimate the percentage of leaf area that is removed from all of the leaves (i.e., defoliation). Record this for each of the examined plants and calculate the field average. Since the majority of soybean are past the initial flowering stage, the economic threshold for defoliation is 20%. At and above this level of defoliation a 3-7% yield loss may occur.
Source: Adam J. Varenhorst, iGrow
The risks of hydrogen sulfide in swine operations have been known for years, but beef operators also need to be aware of the dangers this gas can pose. Increasing this awareness led Dan Andersen, assistant professor and agricultural engineering specialist with Iowa State University Extension and Outreach, to create a series of four publications that provide information and resources to help farmers stay safe when working with manure.hog confinement building
Want to stay ahead in the competitive real estate market? Join https://www.propertyleads.com/real-estate-podcast/ to access exclusive leads and opportunities.
“One breath of hydrogen sulfide at 500 parts per million is enough to render someone unconscious almost immediately,” Andersen said. “Once you realize the gas is a problem it’s usually too late. Hydrogen sulfide gas smells at 1-2 ppm, but levels above that knocks out your ability to smell, so our natural detection system goes away.”
Information about the importance of monitoring for hydrogen sulfide and the types of monitors available for purchase is available in publication AE 3603, “Hydrogen Sulfide Safety – Monitoring.” Monitors are available from ISU Extension and Outreach agricultural engineering specialists who have several models for farmers to test.
“Personal protection meters are a low cost investment, usually around $200, that will notify you if gas is present,” he said. “These instruments can be taken anywhere and are always monitoring the air.”
The second publication in the series, “Hydrogen Sulfide Safety – Manure Agitation” (AE 3604), discusses how to stay safe when agitating manure.
“Manure that is stagnant and sitting around has minimal loss of hydrogen sulfide,” said Andersen. “These levels of hydrogen sulfide are typically not hazardous. But when the manure is agitated and the crust is disrupted, hydrogen sulfide levels can elevate quickly.”
The final two publications in the series focus on barn ventilation for both cattle and swine facilities. “Hydrogen Sulfide Safety – Barn Ventilation at Cattle Facilities” (AE 3605) and “Hydrogen Sulfide Safety – Swine Barn Ventilation” (AE 3606) discuss how to set up a ventilation strategy when working with manure.
“The most important thing to do is to try to maximize airflow,” Andersen said. “When agitating there should be at least a 10 mile per hour breeze and fans can be set up to bring in additional air.”
Proper positioning can also help minimize risks of exposure to gas.
“Think about where you are setting up,” Andersen said. “Don’t stand downwind from the barn if at all possible.”
Source: Iowa State University
Due to drier weather conditions small grain harvests are well ahead of average in some Regions of South Dakota. According to USDA- NASS report published on July 24th, 72% of winter wheat was harvested in the state, while spring wheat and oat harvest acres were 28% and 36% respectively.
Cover Crop Benefits
Interest in using cover crops after small grain is increasing in South Dakota. Cover crops provide diversity into the cropping system, reduce soil erosion, increase soil biological activity, and also help recycle nutrients in the soil. In addition, due to diverse growing habits of major crops and selected cover crop species, it helps to break disease and weed pressure in the field. Also, cover crops can be used as supplemental fall grazing, especially in the year like 2017 where forage shortage is widespread in the state due to prolonged moisture deficit conditions.
Blend Selection
Even though cover crops can be grown as single species or in a mixture of variety of plant species, they are mostly marketed (and grown) as blends. Selecting fall cover crop mix is critical because in a cropping sequence, it should benefit your next cash crop, not hinder with any kind of yield or growth limiting factor. Rule of thumb is- cover crops should possess growth habit that is contrasting to the following cash crop. For example, if a field is going into corn as a next crop, then higher proportion of the cover crop blend should contain cool season broadleaf species because corn is a warm season grass species. Research data from studies conducted at SDSU Southeast Research farm near Beresford have shown yield advantage in corn when grown into cool season broadleaf cover crop mix residue following small grain cash crop.
Broadleaf Categories
Two major categories of broadleaves commonly used as cover crop species are non-legumes (i.e. turnip, radish, canola, rape, etc.) and legumes (i.e. vetch, clovers, pea, lentil, etc.). These cool season species have high tolerance to cool temperatures and rapid fall growth; however, these species are very low in fiber content and may not accumulate abundant residue cover in the spring. In some cases, volunteer small grain growth in the fall can compensate for cool season grass species which can add to some residue next spring. Species like radish and turnip have enhanced tap roots which will aid in breaking compaction in the ground. Legumes on the other hand will help fix atmospheric nitrogen which will contribute to the nitrogen need of other species in the mix such as radish, turnip, rate, etc. Legume species may also add to the soil nitrate content and would be readily available for next season’s crop. These species are generally winter killed. If the crop for next year is soybean, it is suggested to put a mixture high in cool season grasses (rye, oat, barley, triticale, annual ryegrass etc.). These will produce significant amount of biomass the next spring. Winter small grain species like triticale and rye are not generally winter killed in the S.D. environment and requires spring termination which adds extra management task in the spring. Also, producers that are growing wheat or oat grain for seed sale, it is recommended to avoid rye and/or triticale as it may act as significant seed contaminant in subsequent years. On the contrary, winter hardy species like rye can be successfully grown in corn-soybean system and be used as prolonged cover or fall and spring forage options.
Source: David Karki, iGrow
Factors that are likely to increase a return on a foliar fungicide investment include a history of disease, tight rotations, use of a susceptible hybrid, disease pressure at tasseling and weather conditions at tasseling and during grain fill.
Foliar disease management
Foliar fungal diseases of primary concern in Michigan are northern corn leaf blight and gray leaf spot. The fungal pathogens that cause these diseases survive on residue, so fields under minimum tillage and corn-on-corn rotations are at greatest risk. Spores from both of these pathogens can either be splashed up onto foliage or deposited by the wind.
Northern corn leaf blight can be identified by the distinctive lesions that form on the leaves. Lesions start out as light green, but develop into the tell-tale tan or gray “cigar”-shaped lesions. Gray leaf spot lesions typically appear two to three weeks prior to tasseling as narrow, long, rectangular (up to 2 inches) lesions and are light tan, typically delineated by the veins.
Crop rotation will reduce the amount of inoculum of northern corn leaf blight and gray leaf spot present at the start of the season, and tillage can also help to break down corn residue. Scout fields before making a fungicide application. When scouting fields, walk into the field beyond the headland as disease is typically worse along the edge of the field, especially since that is where it is exposed to prevailing winds.
Common rust is another disease typically seen, but often not at economic levels. The rust fungi require a living host to survive. Urediniospores of common rust survive the winter on corn in the southern United States, and are then carried long distances by wind to reach the Midwest. Rust pustules typically appear in late June and are favored by high humidity and moderate temperatures. Most hybrids are fairly resistant and common rust severity is typically not severe enough to warrant selecting resistant hybrids. Crop rotation does not influence common rust disease as it does not survive on residue.
Ear mold management
Ear mold diseases of primary concern in Michigan are Gibberella and Fusarium ear mold. If you are considering making a fungicide application for ear mold suppression, it would be best to use a DMI group fungicide. Currently, Proline is the only fungicide labelled for ear mold suppression in Michigan. The application timing concept is similar to that for managing head scab in wheat. Application timing needs to coincide with silking, as this is the primary infection point for Gibberella ear mold. Studies out of Ontario have demonstrated that an application at full silking gives the best suppression.
Applications of the QoI or strobilurin group of fungicides during flowering have been demonstrated to increase DON levels (vomitoxin) in corn, just like it can in wheat, so caution should be used with this group of fungicides during this period if DON is of primary concern.
In collaboration with Michigan State University assistant professor of cropping systems agronomy Maninder Singh and supported by the Michigan Corn Marketing Program of Michigan, we are currently conducting trials across the state to examine the efficacy of Proline in reducing ear molds and mycotoxins.
MSU Extension suggests considering the following factors to determine if a foliar fungicide is warranted:
- Susceptibility level of corn hybrid. Corn hybrids that are susceptible to disease are more likely to benefit from a foliar fungicide.
- Previous crop. Corn following corn is more likely to develop disease as many of the pathogens survive on corn debris. High levels of corn residue on the surface can increase the severity of disease. Rotation can help to significantly reduce disease pressure.
- Weather. Rainy or humid weather conditions are generally favorable for most foliar diseases; hot, dry conditions typically arrest foliar disease development.
- Irrigation. Frequent irrigation provides moisture for disease development and can exacerbate disease.
- Field history. Planting corn in a field that has a history of foliar disease can increase the chances of disease development. Field location can also influence disease development such as low areas of a field or areas surrounded by trees.
- Disease presence. Is a fungal foliar disease present? The greatest chance of return on a foliar fungicide investment occurs when conditions favoring disease are present, and when fungal disease develops. Losses due to bacterial diseases such as bacterial leaf streak will not benefit from a fungicide application.
- Economics. Foliar fungicides can be used to manage northern corn leaf blight and gray leaf spot, but may not be profitable, especially given current corn prices. Damon Smith at University of Wisconsin-Madison has a nice article summarizing the economics of corn foliar fungicides, “In-Season Corn Disease Management Decisions – 2017.”
Additional resources
- Corn foliar fungicide efficacy chart from MSU Extension
- Arrested ear development, including use of non-ionic surfactants from Purdue University Extension
- Bacterial leaf streak from MSU Extension